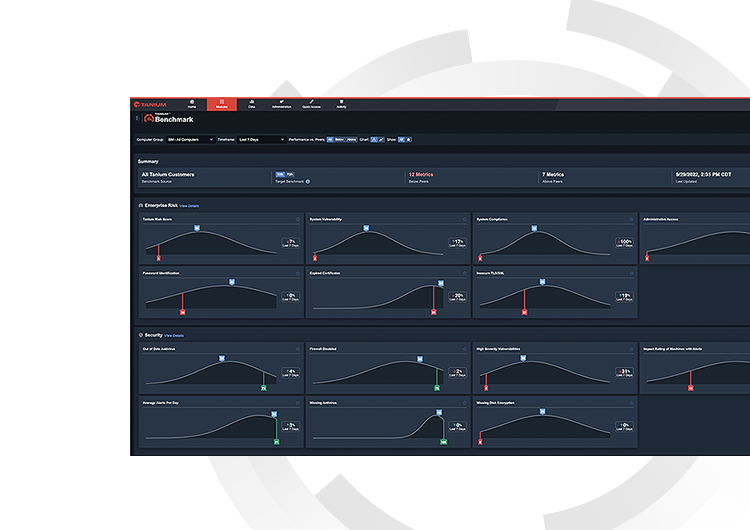
Organizations are missing a unified solution to identify risks and mitigate them in real time
Siloed tools can’t deliver current, accurate, comprehensive or contextual data. As IT leaders, can you answer these questions with certainty?
How do you know
if you are doing a good job securing your data?
How are you creating
an actionable plan to mitigate risk after seeing metrics that are performing worse than industry peers?
Are you able
to remediate your findings in real time from the same console or do you have to send a ticket for another team to fix the issues days or weeks later?
Tanium value metrics
Tanium can help measurably improve IT hygiene and organizational efficiency while reducing risk, complexity and overhead. Tanium customers will need the Risk and Compliance Management and Threat Hunting solution area modules to get the most value from Benchmark. With these solution area modules, Tanium Benchmark can quickly achieve and continuously maintain success along the following value metrics:
Endpoints with critical or high vulnerabilities (% of total within coverage)
How many of your endpoints have critical vulnerabilities? The percent of total endpoints with critical vulnerabilities measures the quantity of endpoints with security exposures, which put organizations at greater risk of disruption or breach.
Patch coverage (% of total endpoints)
Are you scanning your endpoints for patch compliance? The percent of total endpoints covered increases the accuracy of patch compliance reporting while reducing risk.
Security control enabled
What’s the status of disk encryption, antivirus and host firewalls? Continuously monitoring for activation of these technologies improves security, reduces disruption and mitigates risk.

